

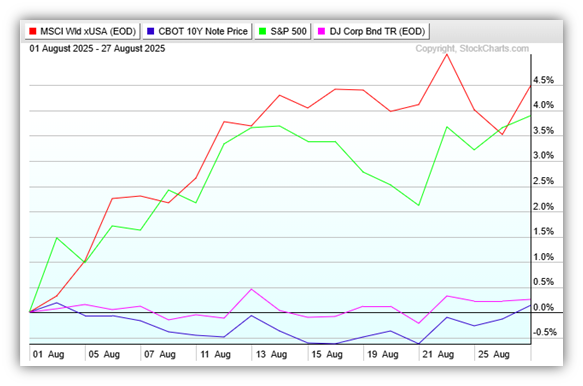
As of Thursday evening, it looks like August will finish as a good month for the markets. Although bonds were relatively flat (corporate bonds in pink and gov’t bonds in blue), major equity indices were generally positive, led by international stocks in red followed by US stocks in green.
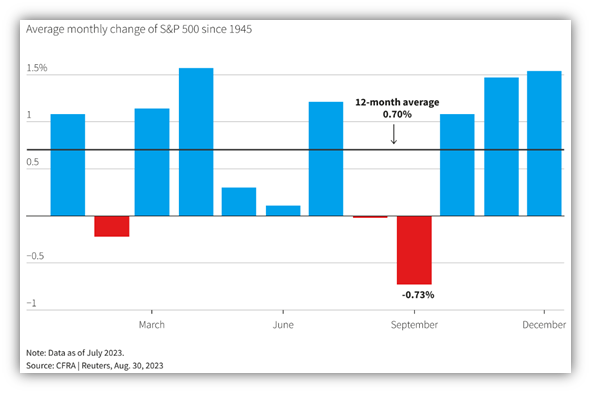
Seasonally speaking, the August – September period has historically been a weak season for stocks. But this year we’re going into the season with a probable interest rate cut in September and solid economic growth in the 2nd quarter. We’ll have to see if it’s good enough to keep markets positive through September.
When measuring the growth of the US economy (Gross Domestic Product, or GDP), there is an enormous amount of data to be analyzed and verified.
As such, the US Bureau of Economic Analysis (BEA) releases three versions of quarterly GDP growth. The first estimate, or advance estimate, is released about 1 month after the end of the quarter being measured. As more data comes in and is analyzed, the second estimate comes out 2 months after quarter-end and the final estimate is published about 3 months after quarter-end.
This week we received the second estimate of GDP for the 2nd quarter and it was 3.3%, stronger than the advance estimate of 3.0% from a month ago. This is a good sign that the US economy is doing better than expected. While there is some concern the economy may be weakening in the 3rd quarter, the Atlanta Fed’s real-time forecast for the current quarter is 2.2% growth while the New York Fed is forecasting 2.01% GDP growth. Basically, US economic growth is solid with no concerns of a recession in the near-term.
https://www.atlantafed.org/cqer/research/gdpnow.aspx
https://www.newyorkfed.org/research/policy/nowcast/#nowcast/2025:Q3
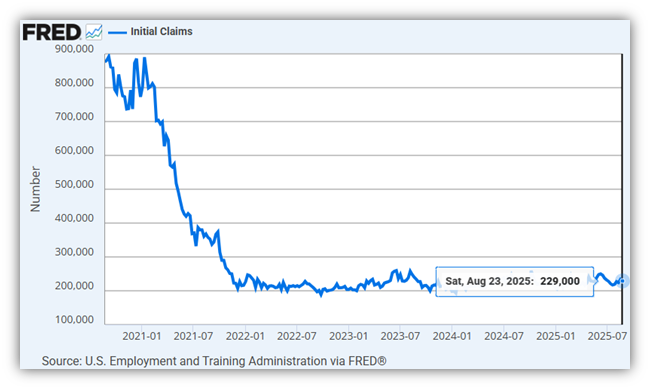
While the labor markets have seen some deceleration in job creation over the summer, the weekly initial unemployment claims are not showing any signs of concern.
Have a great Labor Day weekend.
Jack C. Harmon II, CFP®, CIMA
Principal, Harmon Financial Advisors
Registered Principal, Raymond James Financial Services
Harmon Financial Advisors, Inc. is an independent, fee-based financial planning firm and an independent Registered Investment Advisor. Investment advisory services offered through Raymond James Financial Services Advisors, Inc. and Harmon Financial Advisors, Inc. Securities offered through Raymond James Financial Services, Inc. Member FINRA/SIPC. Harmon Financial Advisors, Inc. is not a registered broker/dealer and is independent of Raymond James Financial Services, Inc.
The information contained in this report does not purport to be a complete description of the securities, markets, or developments referred to in this material. The information in this commercial email has been obtained from sources considered to be reliable, but we do not guarantee that the foregoing material is accurate or complete. Any information is not a complete summary or statement of all available data necessary for making an investment decision and does not constitute a recommendation. Any opinions are those of Harmon Financial Advisors, Inc. and not necessarily those of RJFS or Raymond James.
There is no guarantee that these statements, opinions, or forecasts provided herein will prove to be correct. Past performance may not be indicative of future results.
Investing involves risk and you may incur a profit or loss regardless of strategy selected. International investing involves special risks, including currency fluctuations, differing financial accounting standards, and possible political and economic volatility
Keep in mind that individuals cannot invest directly in any index, and index performance does not include transaction costs or other fees, which will affect actual investment performance. Individual investor’s results will vary.
The S&P 500 is an unmanaged index of 500 widely held stocks that is generally considered representative of the U.S. stock market.
The MSCI World ex USA Index captures large and mid-cap companies across 22 of 23 Developed Markets (DM) countries excluding the United States. With 985 constituents, the index covers approximately 85% of the free float-adjusted market capitalization in each country.
The Dow Jones Corporate Bond Index is an equally weighted basket of 96 recently issued investment-grade corporate bonds with laddered maturities. The index intends to measure the return of readily tradable, high-grade U.S. corporate bonds. It is priced daily.
Bond prices and yields are subject to change based upon market conditions and availability. If bonds are sold prior to maturity, you may receive more or less than your initial investment. There is an inverse relationship between interest rate movements and fixed income prices. Generally, when interest rates rise, fixed income prices fall and when interest rates fall, fixed income prices rise.
Certified Financial Planner Board of Standards Inc. owns the certification marks CFP®, CERTIFIED FINANCIAL PLANNER®, and CFP® in the U.S., which it awards to individuals who successfully complete CFP Board’s initial and ongoing certification requirements.
Investments & Wealth Institute™ (The Institute) is the owner of the certification marks “CIMA” and “Certified Investment Management Analyst.” Use of CIMA and/or Certified Investment Management Analyst signifies that the user has successfully completed The Institute’s initial and ongoing credentialing requirements for investment management professionals.

