

Markets are entering the homestretch for 2025 as we roll into December. The story so far this year has been pretty simple. We began with a couple of months of modest gains before the April tariff announcements on Liberation Day liberated us from those gains. Then, markets have moved steadily higher since the April dip.
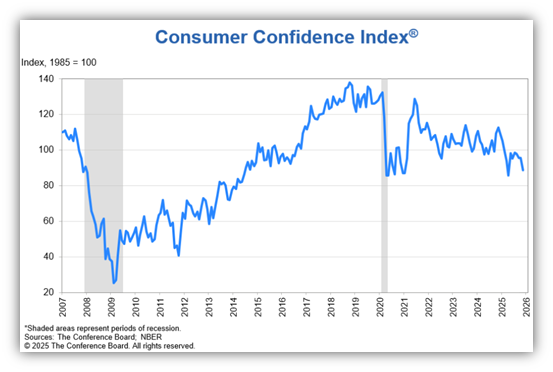
When we attempt to assess the current state of the economy moving into 2026, it’s helpful to look at both what consumers are saying and what they are doing. Polls and surveys alone may paint a pretty bleak picture for the economy. For example, Consumer Confidence fell nearly 7% in November as the longest government shutdown in history dragged on.
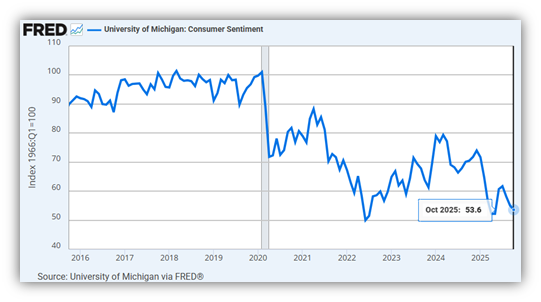
Similarly, the University of Michigan Consumer Sentiment survey is in decline as well.
In a recent poll published by Deloitte in October, 57% of Americans anticipate a weaker economy in 2026 and plan to spend less during the holiday season.
So that’s what many consumers are saying, but what are they actually doing?
“Holiday shopping turnout jumps to 202.9 million people during Thanksgiving weekend, NRF says. The shopping turnout is the largest since NRF began tracking the five-day total in 2017.”
https://www.cnbc.com/2025/12/02/black-friday-cyber-monday-shopping-turnout-nrf.html
“According to Adobe Analytics, U.S. consumers spent $6.4 billion on Thanksgiving Day and $11.8 billion online on Black Friday, both record highs and up significantly compared to last year.”
https://www.newsweek.com/black-friday-spending-raises-eyebrows-over-us-economy-11133753
“K-shaped economy and inflation boost Black Friday sales by 4.1% from last year, online spending jumps 9.1%”
https://www.cnn.com/2025/11/29/business/black-friday-us-econony-spending
CNN correctly points out that we’re in a bifurcated, or K-shaped split economy where the majority of Americans (the lower slant of the K) may be spending less, while those on the upper slant of the K are doing well and spending more. This could be causing many polls and surveys to be accurate, but misleading. The majority of Americans may in fact spend less this year, but what if the minority spending more (those on the upper slant of the K) spend a lot more? So who are these households on the upper slant of the K? It’s safe to say they are members of the top 10% of American taxpayers.
According to the most recent tax data released by the IRS, tax returns with income over $178,611 are in the top 10%.
The top 10% earn 49.4% of all the adjusted gross income reported on tax returns.
The top 10% pay 72.0% of total income taxes paid.
The top 10% had an average tax bill of $99,971 and pay an average effective tax rate of 21.11%
https://taxfoundation.org/data/all/federal/latest-federal-income-tax-data-2025/
Ideally, there would be a lot less people on bottom slant of the K and a greater number of American households could be spending more. But the reality is that our current economy is depending on the spending patterns of a smaller number of consumers to keep the economy growing.
Have a great weekend.
Jack C. Harmon II, CFP®, CIMA
Principal, Harmon Financial Advisors
Registered Principal, Raymond James Financial Services
Harmon Financial Advisors, Inc. is an independent, fee-based financial planning firm and an independent Registered Investment Advisor. Investment advisory services offered through Raymond James Financial Services Advisors, Inc. and Harmon Financial Advisors, Inc. Securities offered through Raymond James Financial Services, Inc. Member FINRA/SIPC. Harmon Financial Advisors, Inc. is not a registered broker/dealer and is independent of Raymond James Financial Services, Inc.
The information contained in this report does not purport to be a complete description of the securities, markets, or developments referred to in this material. The information in this commercial email has been obtained from sources considered to be reliable, but we do not guarantee that the foregoing material is accurate or complete. Any information is not a complete summary or statement of all available data necessary for making an investment decision and does not constitute a recommendation. Any opinions are those of Harmon Financial Advisors, Inc. and not necessarily those of RJFS or Raymond James.
There is no guarantee that these statements, opinions, or forecasts provided herein will prove to be correct. Past performance may not be indicative of future results.
Investing involves risk and you may incur a profit or loss regardless of strategy selected. International investing involves special risks, including currency fluctuations, differing financial accounting standards, and possible political and economic volatility
Keep in mind that individuals cannot invest directly in any index, and index performance does not include transaction costs or other fees, which will affect actual investment performance. Individual investor’s results will vary.
Bond prices and yields are subject to change based upon market conditions and availability. If bonds are sold prior to maturity, you may receive more or less than your initial investment. There is an inverse relationship between interest rate movements and fixed income prices. Generally, when interest rates rise, fixed income prices fall and when interest rates fall, fixed income prices rise.
Certified Financial Planner Board of Standards Inc. owns the certification marks CFP®, CERTIFIED FINANCIAL PLANNER®, and CFP® in the U.S., which it awards to individuals who successfully complete CFP Board’s initial and ongoing certification requirements.
Investments & Wealth Institute™ (The Institute) is the owner of the certification marks “CIMA” and “Certified Investment Management Analyst.” Use of CIMA and/or Certified Investment Management Analyst signifies that the user has successfully completed The Institute’s initial and ongoing credentialing requirements for investment management professionals.
