

After starting the year positive in January, popular US stock indices, such as the S&P 500 (blue) and the Nasdaq (red), are looking to finish February lower and are now relatively flat year-to-date. Bonds (pink) have recovered from their slow start in January and are now up over 1% for the year.
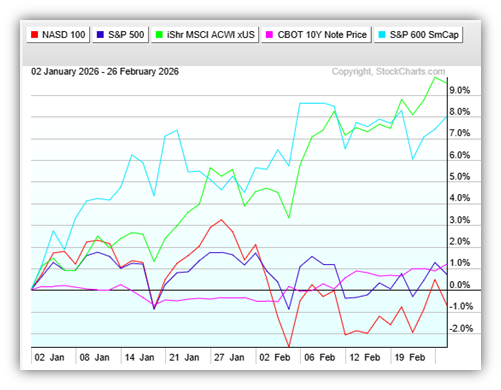
Well-diversified portfolios are doing better, however, as small US companies (light blue) and international companies (green) have done very well this year.
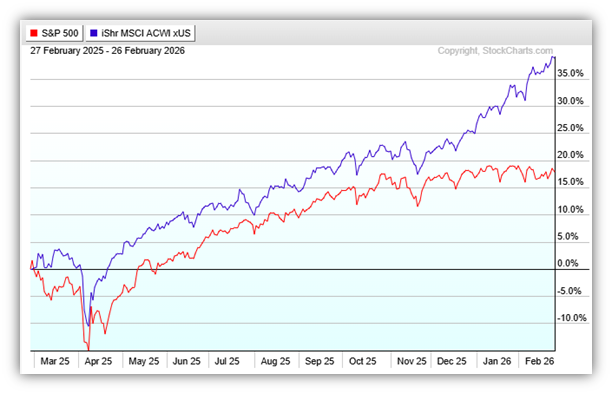
In fact, international stocks (blue below) have more than doubled the return of US large-cap stocks (red below) over the past 12 months.
Unfortunately, most American investors aren’t benefiting much from this international outperformance. Drawing from Vanguard and other sources, Google AI says this –
“While global market capitalization suggests a 40% international stock allocation, the average U.S. investor holds only about 8% to 9% in non-U.S. stocks. Many financial institutions, such as Vanguard, suggest a higher, more diversified target of roughly 20% to 40% of the equity portfolio to better balance risk and capture growth.”
Each January we analyze the recommended allocations of the following firms – not just what they’re saying, but how they’re actually investing.
Vanguard
T. Rowe Price
Fidelity
American Funds
JP Morgan
Schwab
BlackRock
State Street Global Advisors
Principal
Nuveen
This year their average recommended geographic allocation is 34% to international stocks and 66% to US stocks. We think this makes sense as many institutions, including Vanguard, are forecasting international markets to outperform US markets over the next decade.
https://corporate.vanguard.com/content/corporatesite/us/en/corp/vemo/vemo-return-forecasts.html
Have a great weekend.
Jack C. Harmon II, CFP®, CIMA
Principal, Harmon Financial Advisors
Registered Principal, Raymond James Financial Services
Harmon Financial Advisors, Inc. is an independent, fee-based financial planning firm and an independent Registered Investment Advisor. Investment advisory services offered through Raymond James Financial Services Advisors, Inc. and Harmon Financial Advisors, Inc. Securities offered through Raymond James Financial Services, Inc. Member FINRA/SIPC. Harmon Financial Advisors, Inc. is not a registered broker/dealer and is independent of Raymond James Financial Services, Inc.
The information contained in this report does not purport to be a complete description of the securities, markets, or developments referred to in this material. The information in this commercial email has been obtained from sources considered to be reliable, but we do not guarantee that the foregoing material is accurate or complete. Any information is not a complete summary or statement of all available data necessary for making an investment decision and does not constitute a recommendation. Any opinions are those of Harmon Financial Advisors, Inc. and not necessarily those of RJFS or Raymond James.
There is no guarantee that these statements, opinions, or forecasts provided herein will prove to be correct. Past performance may not be indicative of future results.
Investing involves risk and you may incur a profit or loss regardless of strategy selected. International investing involves special risks, including currency fluctuations, differing financial accounting standards, and possible political and economic volatility
Keep in mind that individuals cannot invest directly in any index, and index performance does not include transaction costs or other fees, which will affect actual investment performance. Individual investor’s results will vary.
The S&P 500 is an unmanaged index of 500 widely held stocks that is generally considered representative of the U.S. stock market.
The Nasdaq Composite Index is a market capitalization-weighted index of more than 2,500 stocks listed on the Nasdaq stock exchange. It is a broad index that is heavily weighted toward the important technology sector.
The MSCI ACWI ex USA Index captures large and mid-cap representation across 22 of 23 Developed Markets (DM) countries (excluding the US) and 24 Emerging Markets (EM) countries. With 1,983 constituents, the index covers approximately 85% of the global equity opportunity set outside the US.
The S&P SmallCap 600® seeks to measure the small-cap segment of the U.S. equity market. The index is designed to track companies that meet specific inclusion criteria to ensure that they are liquid and financially viable.
Bond prices and yields are subject to change based upon market conditions and availability. If bonds are sold prior to maturity, you may receive more or less than your initial investment. There is an inverse relationship between interest rate movements and fixed income prices. Generally, when interest rates rise, fixed income prices fall and when interest rates fall, fixed income prices rise.
Certified Financial Planner Board of Standards Inc. owns the certification marks CFP®, CERTIFIED FINANCIAL PLANNER®, and CFP® in the U.S., which it awards to individuals who successfully complete CFP Board’s initial and ongoing certification requirements.
Investments & Wealth Institute™ (The Institute) is the owner of the certification marks “CIMA” and “Certified Investment Management Analyst.” Use of CIMA and/or Certified Investment Management Analyst signifies that the user has successfully completed The Institute’s initial and ongoing credentialing requirements for investment management professionals.
