

Major stock indices were relatively flat this week as November inflation data was released. It showed that consumer prices rose 0.3% in November and the annual inflation rate is 2.7%, all as expected. However, producer prices rose 0.4% in November, higher than the forecasted 0.2%. Ultimately, the November reports are benign and should not have an effect in the Fed’s decision to cut interest rates this month.
Housing affordability is a problem that has many ripple effects across the US economy and is not likely to get much better anytime soon. The Atlanta Fed tracks a simple affordability index on its website that does a good job of illustrating the problem, even though there is a considerable lag in the data. The latest reading is from August.
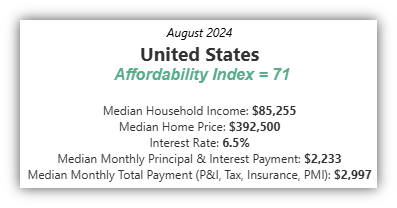
Any reading below 100 is considered to be “unaffordable”. If we take their median US household income of $85,255 per year and divide it by 12 we get a monthly household income of $7,105. A financial planning rule of thumb recommends spending less than 30% of gross monthly income on housing, or $2,131 per month for the median US household. However, the Atlanta Fed calculates that the median home price ($392,500) and current average interest rate (6.5%) yield a median monthly payment of $2,997, or 42% of the median household monthly income. Spending 42% of household income on housing puts a huge strain on the rest of the family budget.
But the top 3 considerations when dealing with real estate are location, location, and location. The index maintained by the Atlanta Fed is using national averages, while income and home prices vary greatly across states and communities. Using local data and the 30% rule (monthly mortgage payment versus monthly gross income) we see that only 2 states currently have affordable housing.

This is a math problem with just a few major variables. Since moving to Iowa or Ohio isn’t an option for everyone, we need to see some combination of the following:
- Lower home prices
- Higher household income
- Lower interest rates
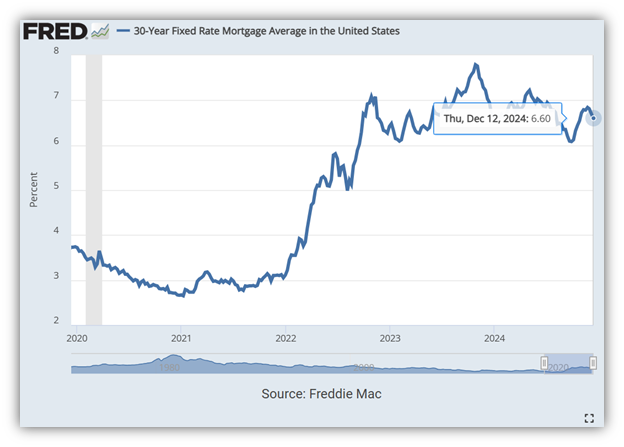
Of these 3 factors, we believe mortgage interest rates are the least likely to decline enough to make a big difference. That leaves higher household income, which is inflationary, and lower home prices.
Have a great weekend.
Jack C. Harmon II, CFP®, CIMA
Principal, Harmon Financial Advisors
Registered Principal, Raymond James Financial Services
Harmon Financial Advisors, Inc. is an independent, fee-based financial planning firm and an independent Registered Investment Advisor. Investment advisory services offered through Raymond James Financial Services Advisors, Inc. and Harmon Financial Advisors, Inc. Securities offered through Raymond James Financial Services, Inc. Member FINRA/SIPC. Harmon Financial Advisors, Inc. is not a registered broker/dealer and is independent of Raymond James Financial Services, Inc.
The information contained in this report does not purport to be a complete description of the securities, markets, or developments referred to in this material. The information in this commercial email has been obtained from sources considered to be reliable, but we do not guarantee that the foregoing material is accurate or complete. Any information is not a complete summary or statement of all available data necessary for making an investment decision and does not constitute a recommendation. Any opinions are those of Harmon Financial Advisors, Inc. and not necessarily those of RJFS or Raymond James.
Investing involves risk and you may incur a profit or loss regardless of strategy selected.
Certified Financial Planner Board of Standards Inc. owns the certification marks CFP®, CERTIFIED FINANCIAL PLANNER™, and CFP® in the U.S., which it awards to individuals who successfully complete CFP Board’s initial and ongoing certification requirements.
Investments & Wealth Institute™ (The Institute) is the owner of the certification marks “CIMA” and “Certified Investment Management Analyst.” Use of CIMA and/or Certified Investment Management Analyst signifies that the user has successfully completed The Institute’s initial and ongoing credentialing requirements for investment management professionals.
The S&P Total Market Index (TMI) is designed to track the broad equity market, including large-, mid-, small-, and micro-cap stocks.
The MSCI World ex USA Index captures large and mid-cap companies across 22 of 23 Developed Markets (DM) countries excluding the United States. With 985 constituents, the index covers approximately 85% of the free float-adjusted market capitalization in each country.
The S&P High Yield Dividend Aristocrats® index is designed to measure the performance of companies within the S&P Composite 1500® that have followed a managed-dividends policy of consistently increasing dividends every year for at least 20 years.
The Dow Jones Corporate Bond Index is an equally weighted basket of 96 recently issued investment-grade corporate bonds with laddered maturities. The index intends to measure the return of readily tradable, high-grade U.S. corporate bonds. It is priced daily.

