

And the markets have bounced back since the losses we experienced in March.
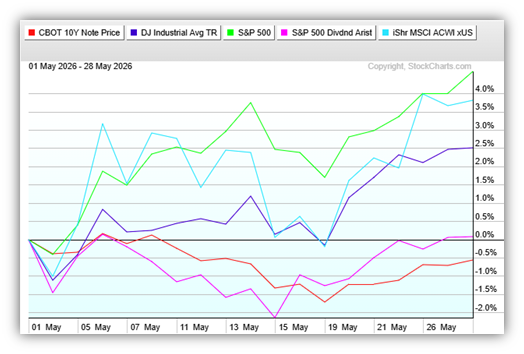
In fact, most major stock indices are now at all-time highs and May is wrapping up as another positive month for most investors. Tech stocks pushed the S&P 500 higher (green) followed by international stocks (light blue). The Dow (purple) was positive but trailed the S&P 500 due to its lower exposure to the technology sector (S&P 500 = 38% tech versus the Dow = 18% tech). Bonds (red) and dividend stocks (pink) were relatively flat for the month as investors favored tech stocks over stability.
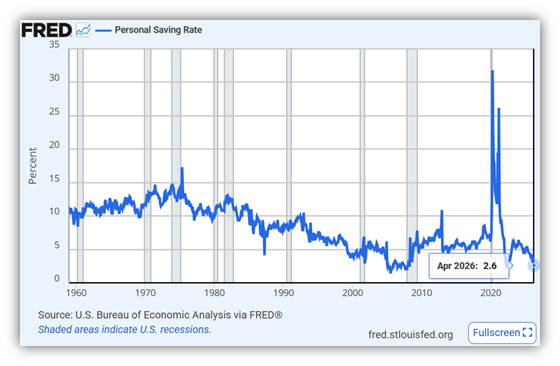
The personal savings rate for April was published this week and showed a sharp drop from 3.2% in March to 2.6% in April as prices (inflation) are rising faster than household incomes. The personal savings rate was 5.5% one year ago and the 30-year average is 5.7%.
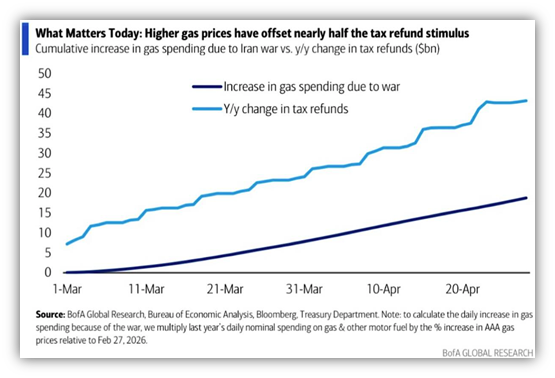
The effect of higher prices on savings would be even worse if it weren’t for larger tax refunds this year. This chart from Bank of America shows that higher gas prices alone have gobbled up almost half of the increased tax refunds so far this year.
It’s important to note that the current “Personal Savings Rate” is simplifying a much more complicated picture of the US consumer. How much a household saves is obviously a function of income. Unable to find a good chart for this, I had Google AI pull this table together.
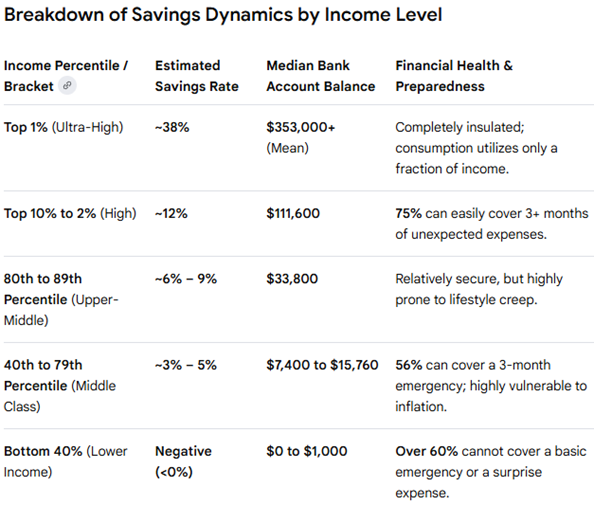
With the top 10% of income earners saving over 10% of their income, their capacity to spend is not being noticeably impacted by higher prices. This is important because, like it or not, these households are responsible for almost half of consumer spending in the US.
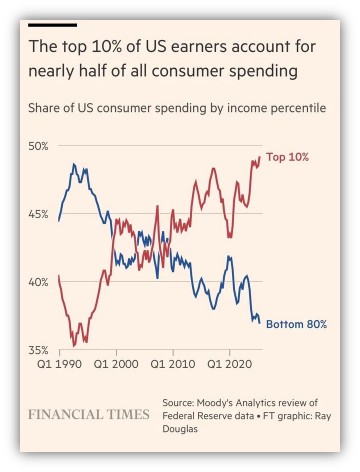
As you can see, there is a lot of disparity in these figures. Both economically and socially speaking, it’s not good for the overall economy to depend so heavily on the behavior of a relatively small group of people. As such, the uncomfortable truth we find ourselves wrestling with is, as the top 10% goes, so goes the economy. And for now, the top 10% are still spending and investing.
Have a great weekend.
Jack C. Harmon II, CFP®, CIMA
Principal, Harmon Financial Advisors
Registered Principal, Raymond James Financial Services
Harmon Financial Advisors, Inc. is an independent, fee-based financial planning firm and an independent Registered Investment Advisor. Investment advisory services offered through Raymond James Financial Services Advisors, Inc. and Harmon Financial Advisors, Inc. Securities offered through Raymond James Financial Services, Inc. Member FINRA/SIPC. Harmon Financial Advisors, Inc. is not a registered broker/dealer and is independent of Raymond James Financial Services, Inc.
The information contained in this report does not purport to be a complete description of the securities, markets, or developments referred to in this material. The information in this commercial email has been obtained from sources considered to be reliable, but we do not guarantee that the foregoing material is accurate or complete. Any information is not a complete summary or statement of all available data necessary for making an investment decision and does not constitute a recommendation. Any opinions are those of Harmon Financial Advisors, Inc. and not necessarily those of RJFS or Raymond James.
There is no guarantee that these statements, opinions, or forecasts provided herein will prove to be correct. Past performance may not be indicative of future results.
Investing involves risk and you may incur a profit or loss regardless of strategy selected. International investing involves special risks, including currency fluctuations, differing financial accounting standards, and possible political and economic volatility.
The Dow Jones Industrial Average (DJIA), commonly known as “The Dow” is an index representing 30 stocks of companies maintained and reviewed by the editors of the Wall Street Journal.
The S&P 500 is an unmanaged index of 500 widely held stocks that is generally considered representative of the U.S. stock market.
The MSCI World ex USA Index captures large and mid-cap companies across 22 of 23 Developed Markets (DM) countries excluding the United States. With 985 constituents, the index covers approximately 85% of the free float-adjusted market capitalization in each country.
S&P 500® Dividend Aristocrats® measure the performance of S&P 500 companies that have increased dividends every year for the last 25 consecutive years. The Index treats each constituent as a distinct investment opportunity without regard to its size by equally weighting each company.
Keep in mind that individuals cannot invest directly in any index, and index performance does not include transaction costs or other fees, which will affect actual investment performance. Individual investors’ results will vary.
Certified Financial Planner Board of Standards Inc. owns the certification marks CFP®, CERTIFIED FINANCIAL PLANNER®, and CFP® in the U.S., which it awards to individuals who successfully complete CFP Board’s initial and ongoing certification requirements.
Investments & Wealth Institute™ (The Institute) is the owner of the certification marks “CIMA” and “Certified Investment Management Analyst.” Use of CIMA and/or Certified Investment Management Analyst signifies that the user has successfully completed The Institute’s initial and ongoing credentialing requirements for investment management professionals.
