The St. Louis Fed publishes a website with lots of good economic data called FRED, which unimaginatively stands for Federal Reserve Economic Data and it’s available under the Research tab on their home page – https://www.stlouisfed.org/
Also on their home page is their Pulse of the Economy. It’s a summary of the three most important numbers to watch regarding the current health of the US economy.

This is similar to capturing your heart rate, temperature, and blood pressure at a given moment. These three measurements can tell us a lot about your current situation, but even if all three are normal, a lot can still be wrong with you. The same holds true for the economy. The big three numbers are currently good, historically speaking, but the patient definitely has some underlying problems and unhealthy habits that need to be addressed.
US stocks were positive this week while non-US stocks are down. The same three factors continue to impact the market this week as before – bond yields at 24-year highs, higher energy prices and inflation, and the narrowness of the US stock market as a handful of companies in one sector of the market dominate earnings growth.
As bond yields rise, their return begins to compete with other types of investments, like stocks. It’s easy to look at a 10-year treasury yielding 5.3% and be tempted to just buy a treasury note and hold it for 10 years. That’s a 5.3% per year rate of return, right? Not exactly.
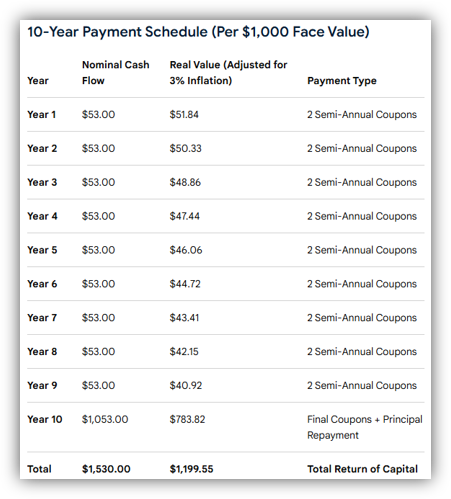
If you purchase a 10-year treasury yielding 5.3% today for $1,000 face value, you will receive $530 in interest payments over the next 10 years (nominal cash flow above), plus the return of your $1,000 investment 10 years from now. So, your $1,000 investment today would result in a total return of $1,530 over 10 years, assuming you don’t reinvest the interest payments. Alternatively, the total return of a $1,000 investment growing to $1,530 in 10 years is a compound annual growth rate of 4.344% per year.
Now let’s consider the real return killer – inflation. Each annual interest payment has a little less purchasing power than the one before as inflation takes its toll over time. By Year 9, you can see above that your original 5.3% rate is down to a real payment of less than 4.1% of your original investment. And finally, when the US government returns your original $1,000 in Year 10, it’s only worth $737.42 in inflation-adjusted dollars. After loaning the US government $1,000 in Year 1, you will receive a total of $1,200 of interest payments and return of principle, net of inflation.
Alternatively, the real return of a $1,000 investment that grows to a total of $1,200 over 10 years is 1.84% per year. And finally, this illustration does not include the effect of income taxes on the interest payments.
This is why all investments need to be evaluated “triple-net” – net of inflation, net of taxes, and net of fees.
One final thought. Last week I mentioned that bonds had lost money in each of the three negative months for stocks this year. Actually, this trend began in 2020.
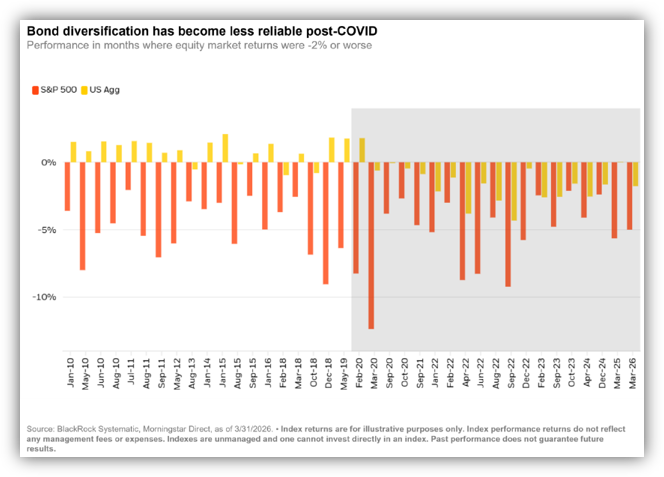
Historically, bonds frequently provided positive returns during times when stocks were down, but since 2020, bonds have been consistently negative in months when stocks were down 2% or more.
Have a great weekend.
Jack C. Harmon II, CFP®, CIMA
Principal, Harmon Financial Advisors
Registered Principal, Raymond James Financial Services
Harmon Financial Advisors, Inc. is an independent, fee-based financial planning firm and an independent Registered Investment Advisor. Investment advisory services offered through Raymond James Financial Services Advisors, Inc. and Harmon Financial Advisors, Inc. Securities offered through Raymond James Financial Services, Inc. Member FINRA/SIPC. Harmon Financial Advisors, Inc. is not a registered broker/dealer and is independent of Raymond James Financial Services, Inc.
The information contained in this report does not purport to be a complete description of the securities, markets, or developments referred to in this material. The information in this commercial email has been obtained from sources considered to be reliable, but we do not guarantee that the foregoing material is accurate or complete. Any information is not a complete summary or statement of all available data necessary for making an investment decision and does not constitute a recommendation. Any opinions are those of Harmon Financial Advisors, Inc. and not necessarily those of RJFS or Raymond James.
There is no guarantee that these statements, opinions, or forecasts provided herein will prove to be correct. Past performance may not be indicative of future results.
Investing involves risk and you may incur a profit or loss regardless of strategy selected. International investing involves special risks, including currency fluctuations, differing financial accounting standards, and possible political and economic volatility.
The S&P 500 is an unmanaged index of 500 widely held stocks that is generally considered representative of the U.S. stock market.
The Bloomberg US Aggregate Bond Index is a broad-based flagship benchmark that measures the investment grade, US dollar-denominated, fixed-rate taxable bond market. The index includes Treasuries, government-related and corporate securities, fixed-rate agency MBS, ABS and CMBS (agency and non-agency).
Bond prices and yields are subject to change based upon market conditions and availability. If bonds are sold prior to maturity, you may receive more or less than your initial investment. There is an inverse relationship between interest rate movements and fixed income prices. Generally, when interest rates rise, fixed income prices fall and when interest rates fall, fixed income prices rise.
U.S. government bonds and Treasury notes are guaranteed by the U.S. government and, if held to maturity, offer a fixed rate of return and guaranteed principal value. U.S. government bonds are issued and guaranteed as to the timely payment of principal and interest by the federal government. Treasury notes are certificates reflecting intermediate-term (2 – 10 years) obligations of the U.S. government.
Keep in mind that individuals cannot invest directly in any index, and index performance does not include transaction costs or other fees, which will affect actual investment performance. Individual investors’ results will vary.
Certified Financial Planner Board of Standards Inc. owns the certification marks CFP®, CERTIFIED FINANCIAL PLANNER®, and CFP® in the U.S., which it awards to individuals who successfully complete CFP Board’s initial and ongoing certification requirements.
Investments & Wealth Institute™ (The Institute) is the owner of the certification marks “CIMA” and “Certified Investment Management Analyst.” Use of CIMA and/or Certified Investment Management Analyst signifies that the user has successfully completed The Institute’s initial and ongoing credentialing requirements for investment management professionals.