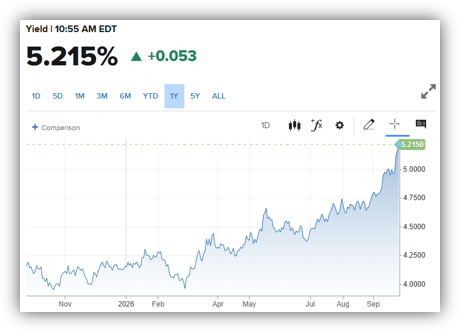
We’ve seen a meaningful divergence on display in the stock market this month as the global bond selloff has pushed yields sharply higher.
In the past couple of weeks, we’ve discussed the drivers behind rising bond yields, and now they’re causing a division among stocks this month. In the chart below, we see dividend-paying stocks (green) getting hammered (down over 4.5%) as more attractive bond yields will inevitably draw some income-seeking investors from dividend stocks to bonds. Speaking of bonds (red), they’re down over 2.5% this month as higher yields make almost all existing bonds worth less.
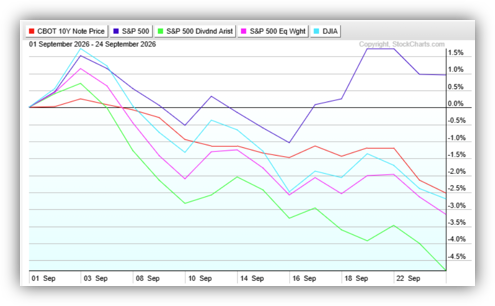
But here’s the big split. The standard S&P 500 index (blue) remains up almost 1% this month, while the Dow (light blue) and the equal-weight S&P 500 (pink) are both down over 2.5%.
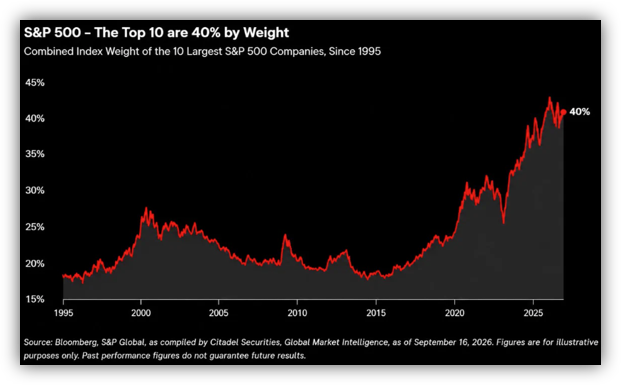
This is because the standard S&P 500 index gives more weight to larger companies. This is often referred to as the cap-weighted S&P 500, short for capitalization-weighted. Currently, the 10 largest companies are now almost 40% of the value of the S&P 500 and accounted for 34% of the profits as of May.
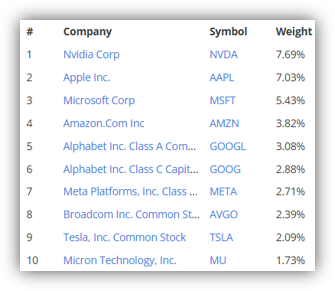
https://www.slickcharts.com/sp500
“The S&P 500 is not a diversified index anymore; it is dominated by a small number of extraordinarily profitable tech companies.”
Alternatively, the Dow is not cap-weighted. Instead, it uses an antiquated methodology I won’t go into here, but it results in just a 17% technology weighting.
Finally, the equal-weight S&P 500 does just what it says – it weights all companies in the S&P 500 equally, about 0.2% each. This gives the largest 10 companies a weighting of 2% as opposed to nearly 40% in the standard S&P 500, and an overall technology weighting of about 17%, like the Dow.
Despite concerns pushing most stocks lower this month, investors have unsurprisingly been reluctant to sell the 10 stocks responsible for the most concentrated market in history.
Have a great weekend.
Jack C. Harmon II, CFP®, CIMA
Principal, Harmon Financial Advisors
Registered Principal, Raymond James Financial Services
Harmon Financial Advisors, Inc. is an independent, fee-based financial planning firm and an independent Registered Investment Advisor. Investment advisory services offered through Raymond James Financial Services Advisors, Inc. and Harmon Financial Advisors, Inc. Securities offered through Raymond James Financial Services, Inc. Member FINRA/SIPC. Harmon Financial Advisors, Inc. is not a registered broker/dealer and is independent of Raymond James Financial Services, Inc.
The information contained in this report does not purport to be a complete description of the securities, markets, or developments referred to in this material. The information in this commercial email has been obtained from sources considered to be reliable, but we do not guarantee that the foregoing material is accurate or complete. Any information is not a complete summary or statement of all available data necessary for making an investment decision and does not constitute a recommendation. Any opinions are those of Harmon Financial Advisors, Inc. and not necessarily those of RJFS or Raymond James.
There is no guarantee that these statements, opinions, or forecasts provided herein will prove to be correct. Past performance may not be indicative of future results.
Investing involves risk and you may incur a profit or loss regardless of strategy selected. International investing involves special risks, including currency fluctuations, differing financial accounting standards, and possible political and economic volatility.
The S&P 500 is an unmanaged index of 500 widely held stocks that is generally considered representative of the U.S. stock market.
The S&P 500® Equal Weight Index (EWI) is the equal-weight version of the widely used S&P 500. The index includes the same constituents as the capitalization weighted S&P 500, but each company in the S&P 500 EWI is allocated a fixed weight – or 0.2% of the index total at each quarterly rebalance.
The S&P High Yield Dividend Aristocrats® index is designed to measure the performance of companies within the S&P Composite 1500® that have followed a managed-dividends policy of consistently increasing dividends every year for at least 20 years.
The Dow Jones Industrial Average (DJIA), commonly known as “The Dow” is an index representing 30 stocks of companies maintained and reviewed by the editors of the Wall Street Journal.
Bond prices and yields are subject to change based upon market conditions and availability. If bonds are sold prior to maturity, you may receive more or less than your initial investment. There is an inverse relationship between interest rate movements and fixed income prices. Generally, when interest rates rise, fixed income prices fall and when interest rates fall, fixed income prices rise.
U.S. government bonds and Treasury notes are guaranteed by the U.S. government and, if held to maturity, offer a fixed rate of return and guaranteed principal value. U.S. government bonds are issued and guaranteed as to the timely payment of principal and interest by the federal government. Treasury notes are certificates reflecting intermediate-term (2 – 10 years) obligations of the U.S. government.
Keep in mind that individuals cannot invest directly in any index, and index performance does not include transaction costs or other fees, which will affect actual investment performance. Individual investors’ results will vary.
Certified Financial Planner Board of Standards Inc. owns the certification marks CFP®, CERTIFIED FINANCIAL PLANNER®, and CFP® in the U.S., which it awards to individuals who successfully complete CFP Board’s initial and ongoing certification requirements.
Investments & Wealth Institute™ (The Institute) is the owner of the certification marks “CIMA” and “Certified Investment Management Analyst.” Use of CIMA and/or Certified Investment Management Analyst signifies that the user has successfully completed The Institute’s initial and ongoing credentialing requirements for investment management professionals.